Prometheus 系统监控与报警部署笔记
💡 Prometheus 简介
Prometheus 是一个开源的系统监控和报警系统,在 2012 年由 SoundCloud 公司创建,并于 2015 年正式发布。2016 年,Prometheus 正式加入 CNCF (Cloud Native Computing Foundation),成为继 Kubernetes 之后第二个在 CNCF 托管的项目,现已广泛用于在容器和微服务领域中得到了广泛的应用,当然不仅限于此。Prometheus 本身基于 Go 语言开发的一套开源的系统监控报警框架和时序列数据库(TSDB)。
Prometheus 的监控功能很完善和全面,性能也足够支撑上万台规模的集群。
1. Prometheus 基本原理
Prometheus 的基本原理是通过 HTTP 协议周期性抓取被监控组件的状态,任意组件只要提供对应的 HTTP 接口就可以接入监控。不需要任何 SDK 或者其他的集成过程。这样做非常适合做虚拟化环境监控系统,比如 VM、Docker、Kubernetes 等。输出被监控组件信息的 HTTP 接口被叫做 exporter。目前互联网公司常用的组件大部分都有 exporter 可以直接使用,比如 Varnish、Haproxy、Nginx、MySQL、Linux 系统信息 (包括磁盘、内存、CPU、网络等等)。
其大概的工作流程是:
- Prometheus server 定期从配置好的 jobs 或者 exporters 中拉 metrics,或者接收来自 Pushgateway 发过来的 metrics,或者从其他的 Prometheus server 中拉 metrics。
- Prometheus server 在本地存储收集到的 metrics,并运行已定义好的 alert.rules,记录新的时间序列或者向 Alertmanager 推送警报。
- Alertmanager 根据配置文件,对接收到的警报进行处理,发出告警。
- 在 Grafana 图形界面中,可视化查看采集数据。
2. 部署 Prometheus
2.1 安装 Docker
安装方式网上很多,可自行查找,本文使用 LinuxMirrors 的脚本安装,很方便。
-
GNU/Linux 更换系统软件源脚本
bash <(curl -sSL https://linuxmirrors.cn/main.sh) -
Docker 安装脚本
bash <(curl -sSL https://linuxmirrors.cn/docker.sh)
2.2 下载镜像包
docker pull prom/prometheus

docker pull grafana/grafana

docker pull prom/node-exporter
2.3 启动 Prometheus
创建 prometheus 挂载目录
mkdir -p /data/prometheus创建 prometheus 配置文件
# my global config
global:
  scrape_interval: 15s # Set the scrape interval to every 15 seconds. Default is every 1 minute.
  evaluation_interval: 15s # Evaluate rules every 15 seconds. The default is every 1 minute.
  # scrape_timeout is set to the global default (10s).

# Alertmanager configuration
alerting:
  alertmanagers:
    - static_configs:
        - targets:
          # - alertmanager:9093

# Load rules once and periodically evaluate them according to the global 'evaluation_interval'.
rule_files:
  # - "first_rules.yml"
  # - "second_rules.yml"

# A scrape configuration containing exactly one endpoint to scrape:
# Here it's Prometheus itself.
scrape_configs:
  # The job name is added as a label `job=<job_name>` to any timeseries scraped from this config.
  - job_name: "prometheus"

    # metrics_path defaults to '/metrics'
    # scheme defaults to 'http'.

    static_configs:
      - targets: ["localhost:9090"]
       # The label name is added as a label `label_name=<label_value>` to any timeseries scraped from this config.
        labels:
          app: "prometheus"

  - job_name: "grafana"

    static_configs:
      - targets: ["192.168.3.34:9100"]
        labels:
          instance: "ubuntu"
启动
docker run -d \
--name=prometheus \
-p 9090:9090 \
-v /data/prometheus/prometheus.yml:/etc/prometheus/prometheus.yml \
prom/prometheus
查看端口状态
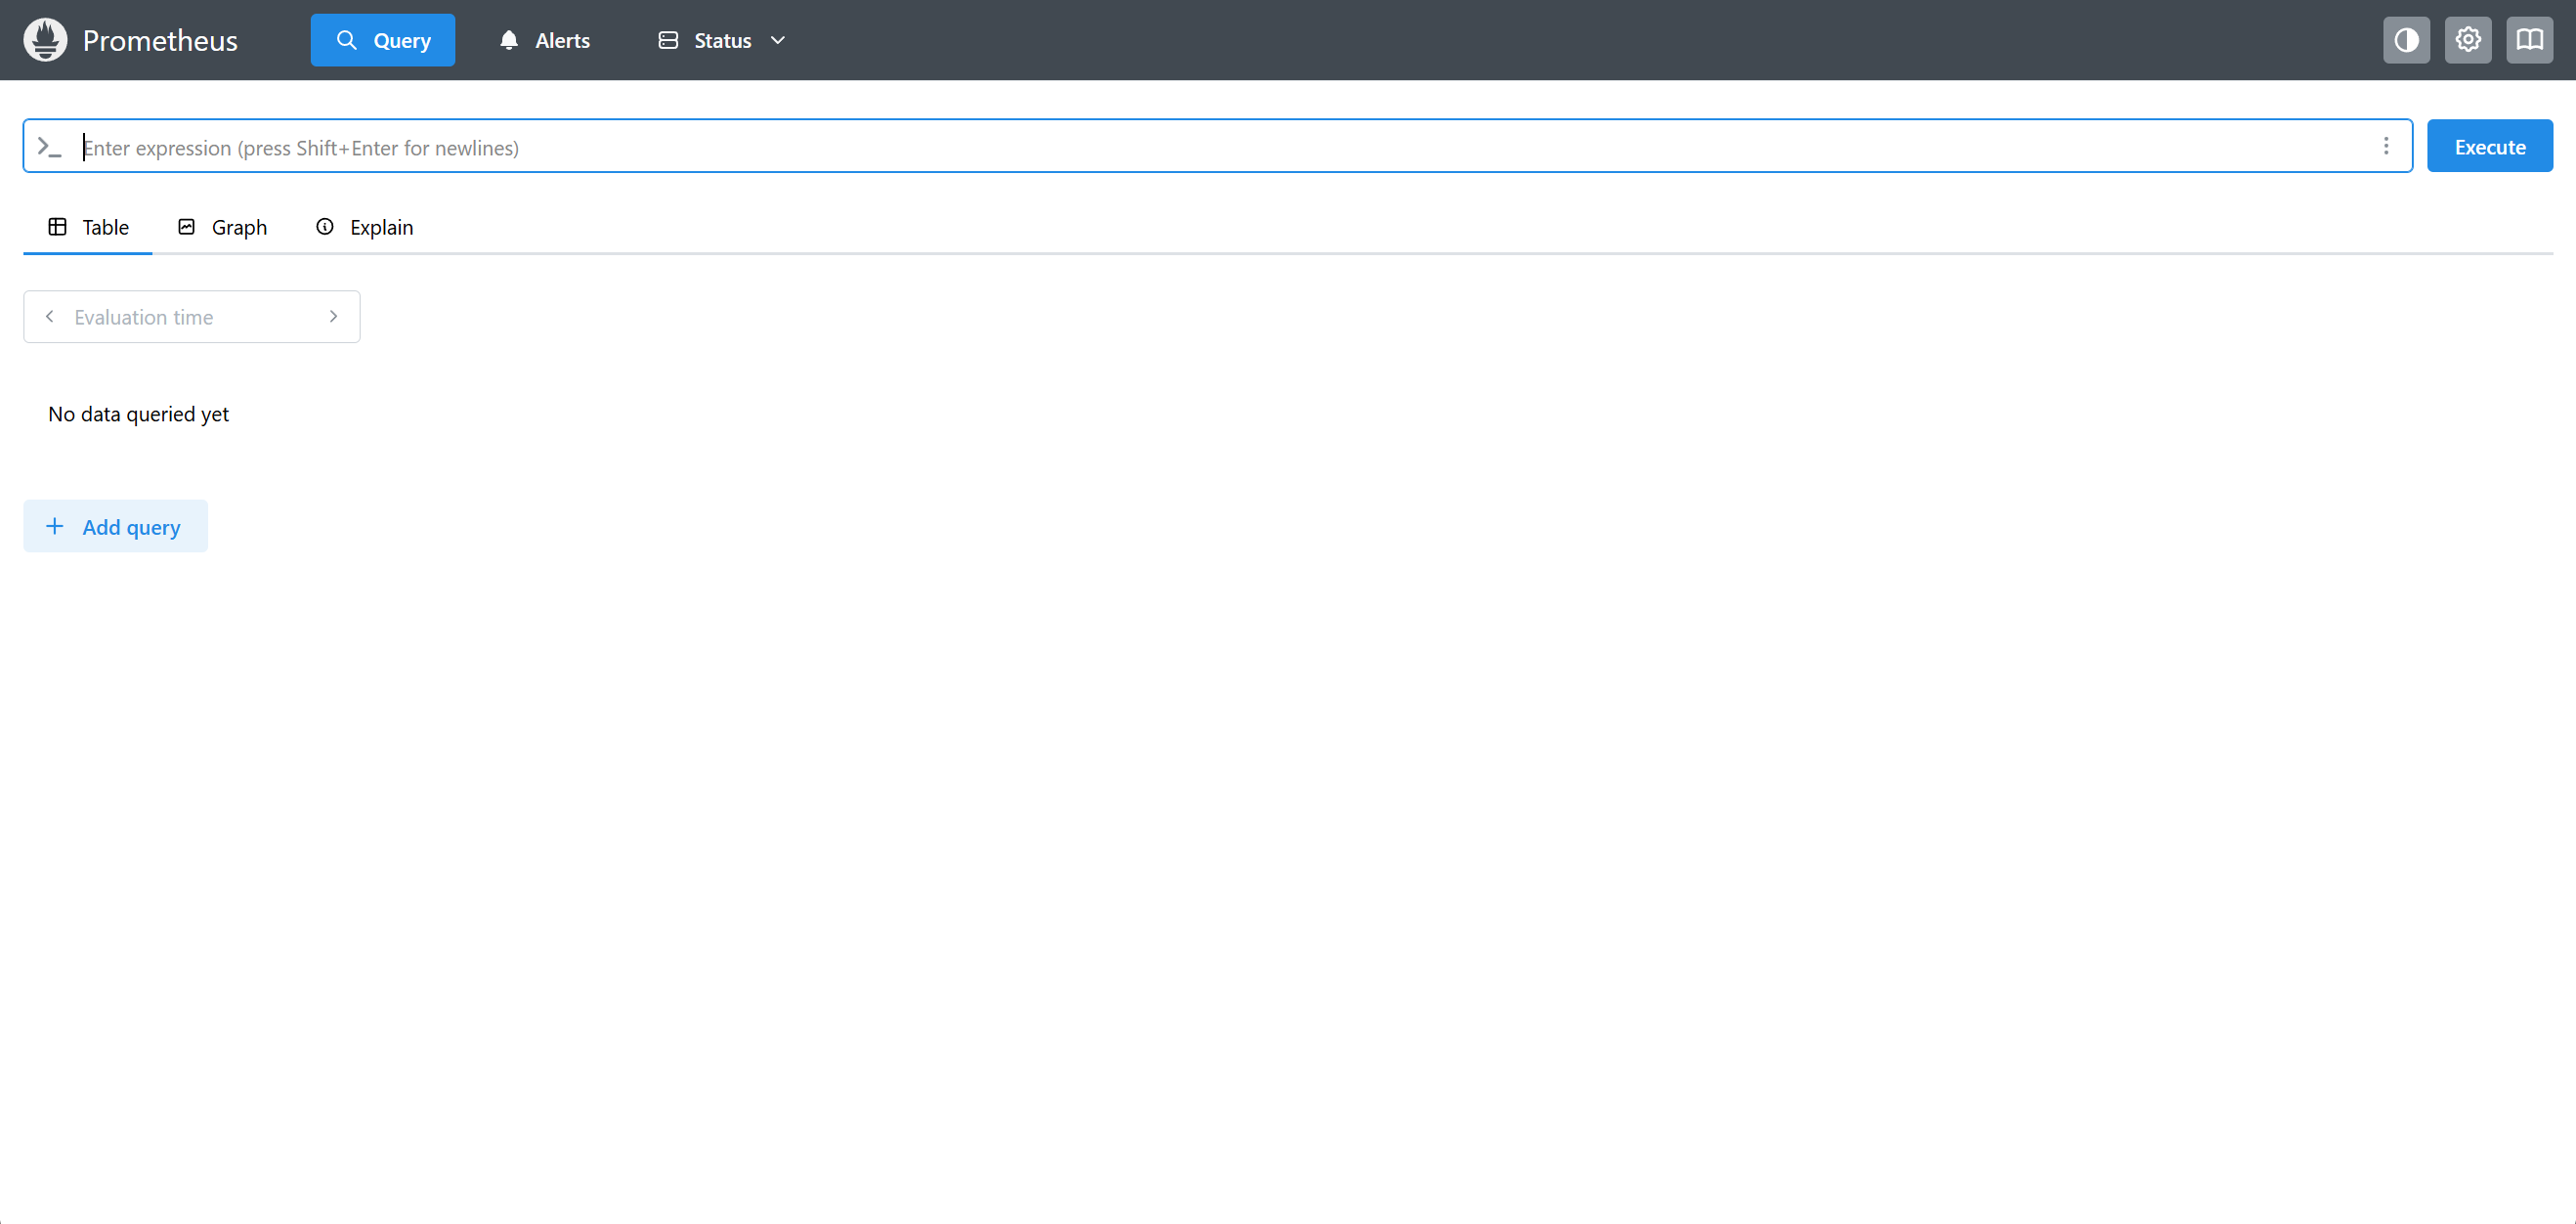
netstat -antupl |grep 9090访问地址 ip:9090
3. 部署 Grafana
创建数据挂载目录
mkdir /data/grafana设置权限
chmod 777 -R /data/grafana启动 grafana
docker run -d \
--name=grafana \
-p 3000:3000 \
-v /data/grafana:/var/lib/grafana \
grafana/grafana访问地址:ip:3000,默认都是 admin
4. 部署 Node-exporter
docker run -d -p 9100:9100 \
-v "/proc:/host/proc:ro" \
-v "/sys:/host/sys:ro" \
-v "/:/rootfs:ro" \
--net="host" \
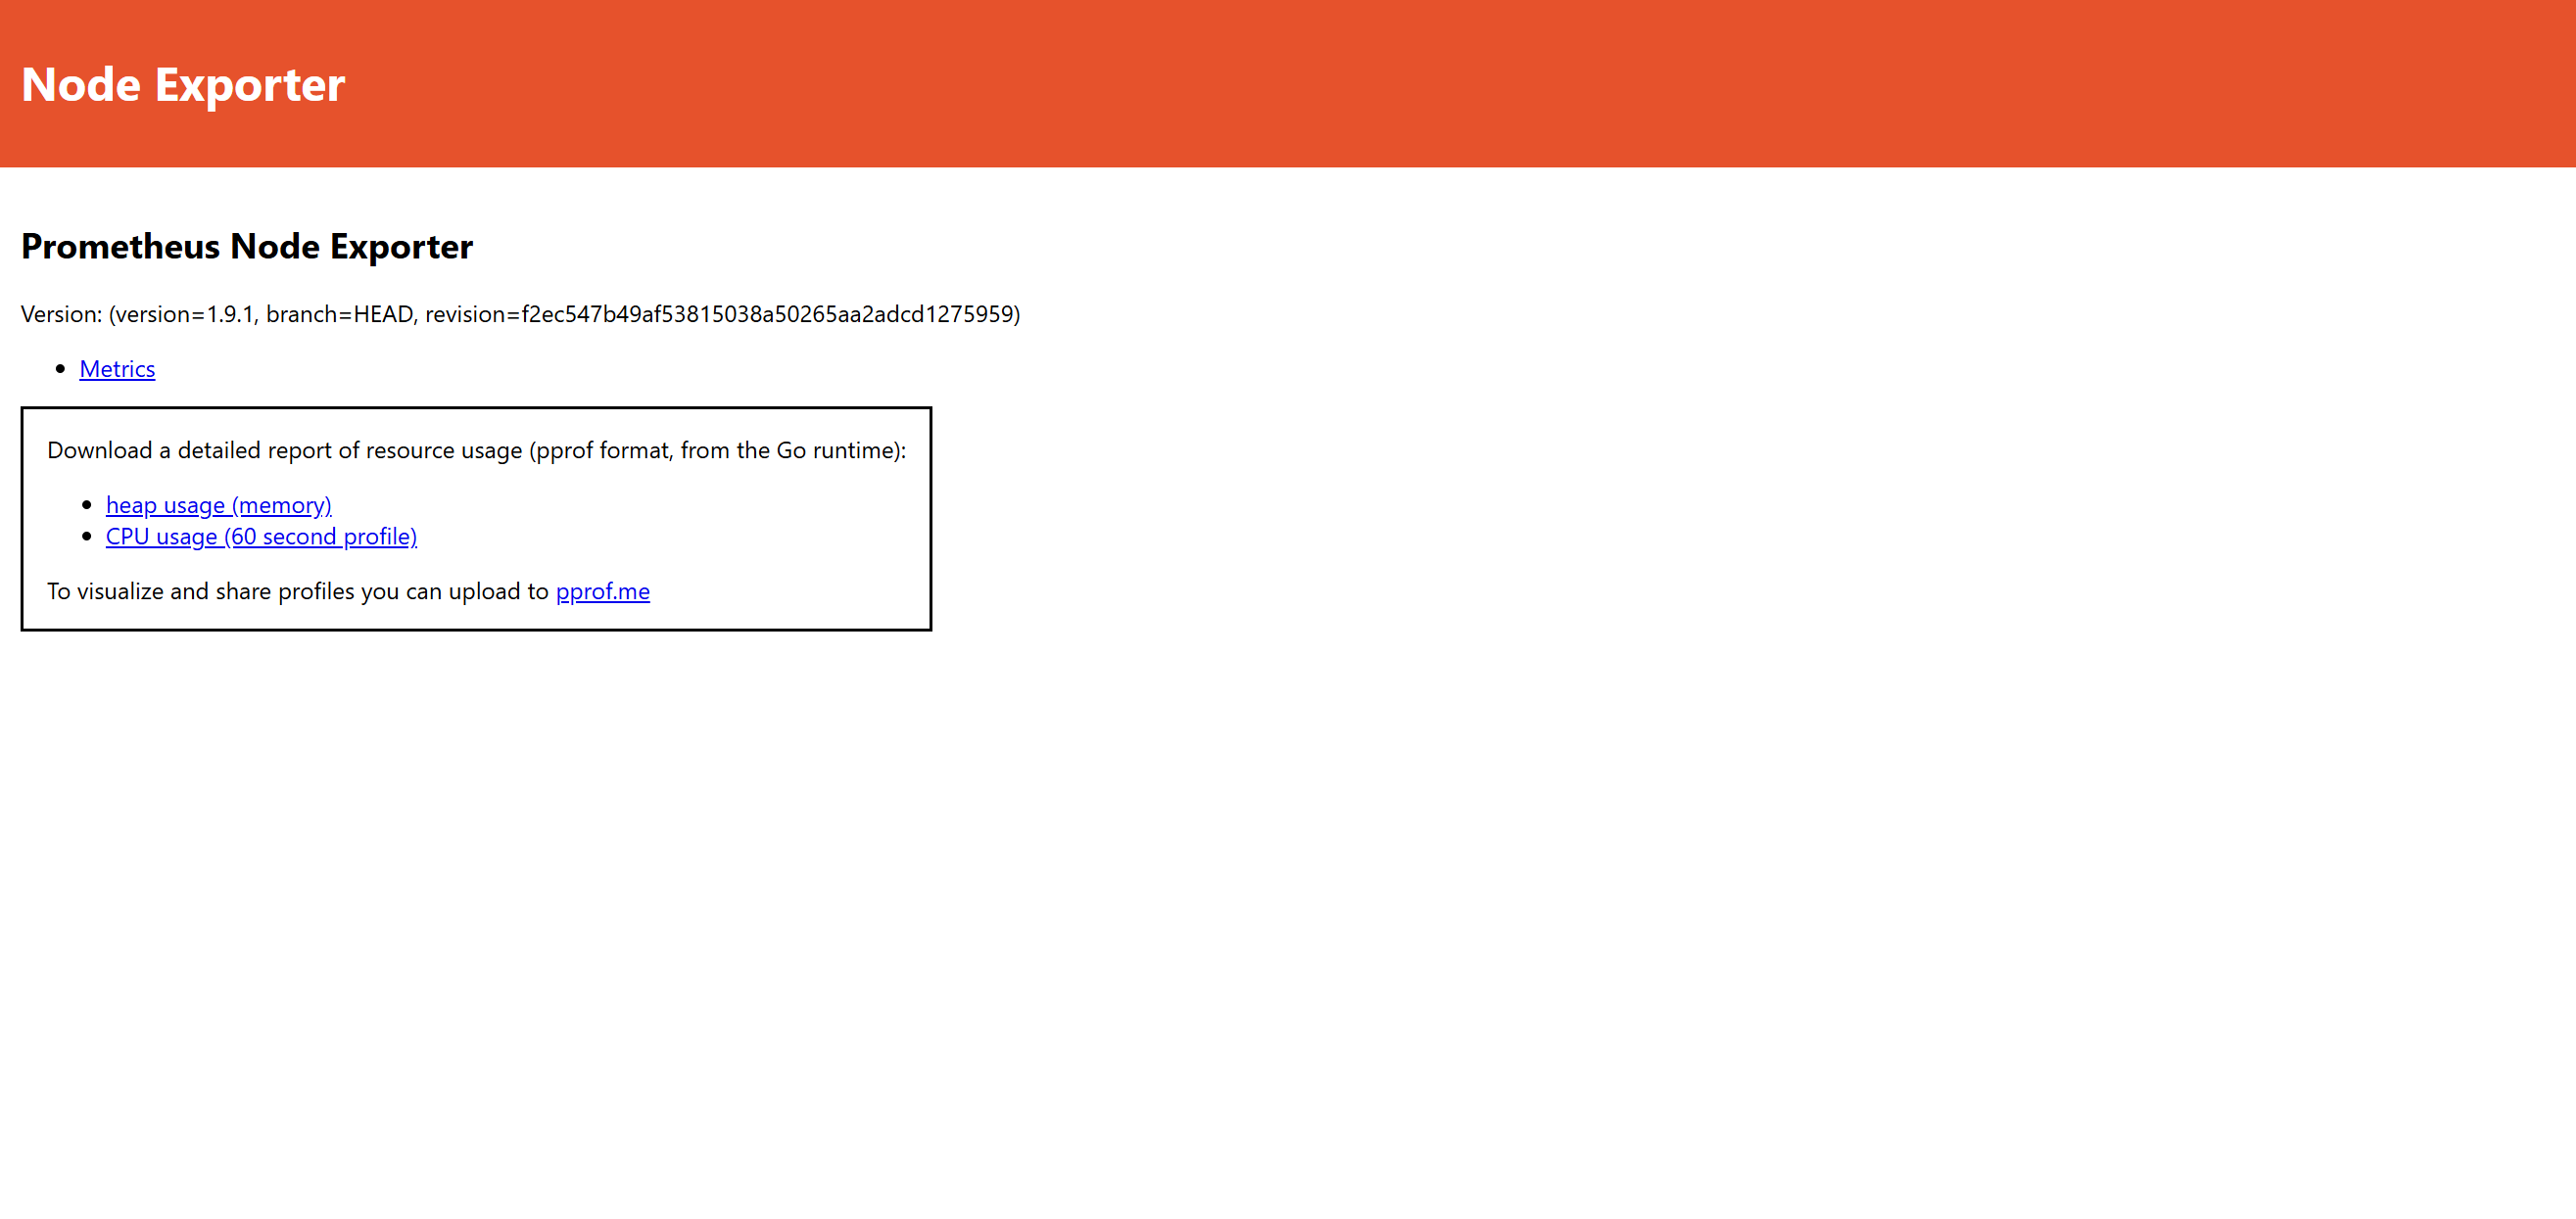
prom/node-exporter访问 ip:9100
5. 添加监控节点
在另一台主机上安装 docker,并部署 node-exporter。
修改 prometheus 配置文件,在 scrape_configs 部分添加新的 job_name:
  - job_name: "test"

    static_configs:
      - targets: ["192.168.3.35:9100"]
        labels:
          instance: "ubuntu"
重启 prometheus
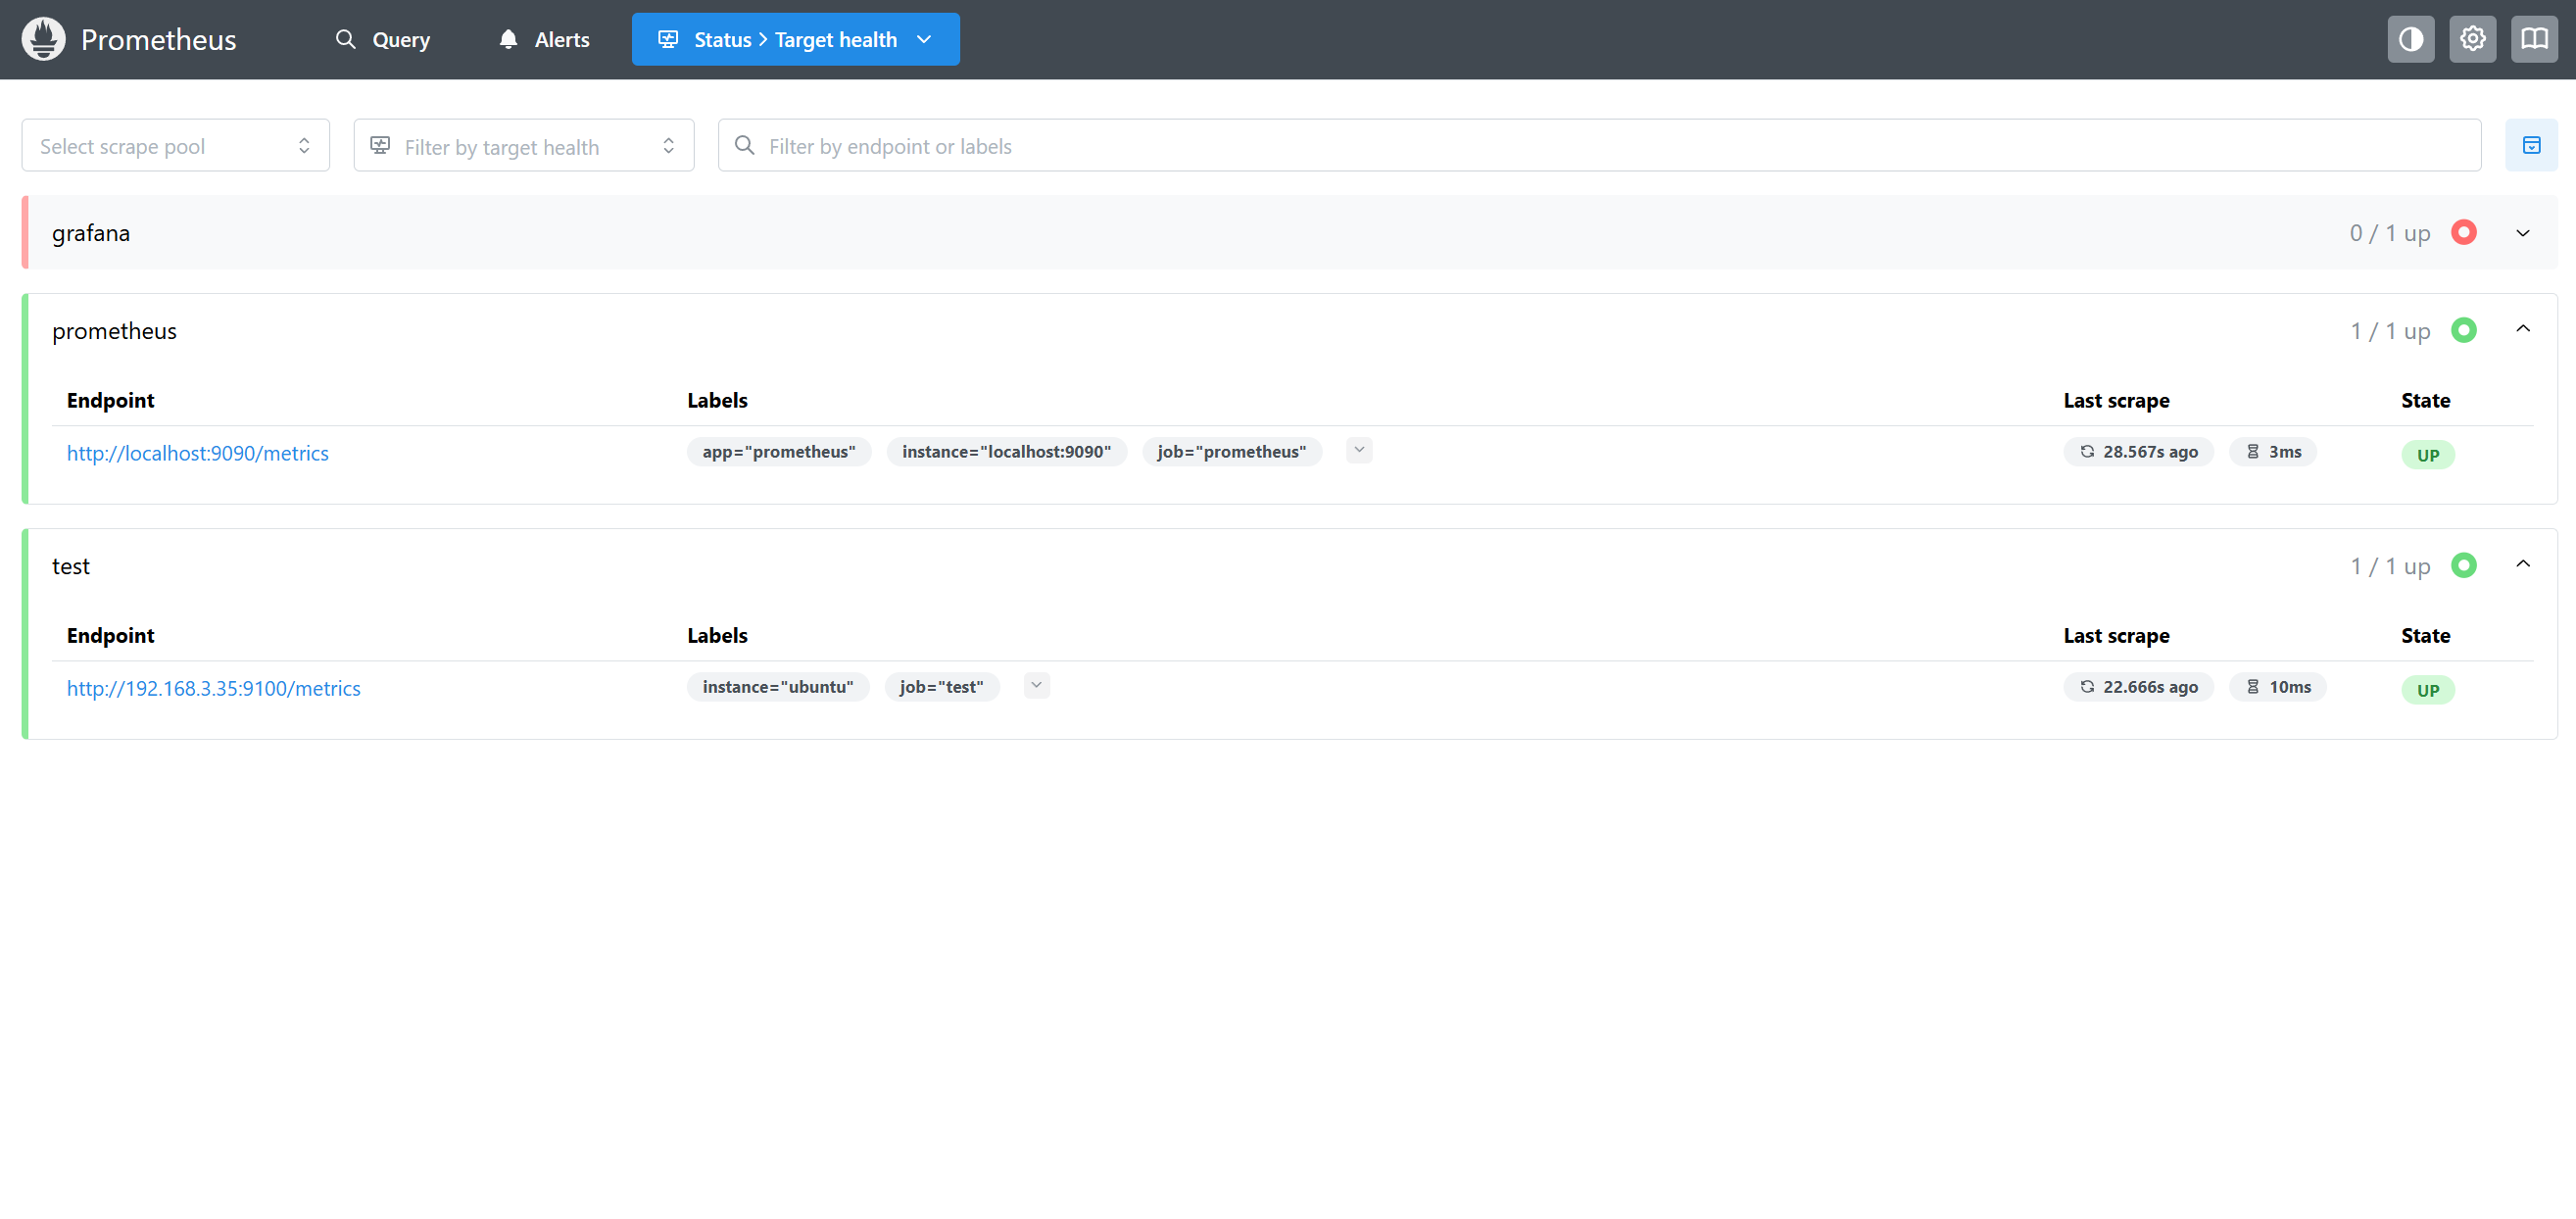
sudo docker restart prometheus访问 prometheus status > Target health
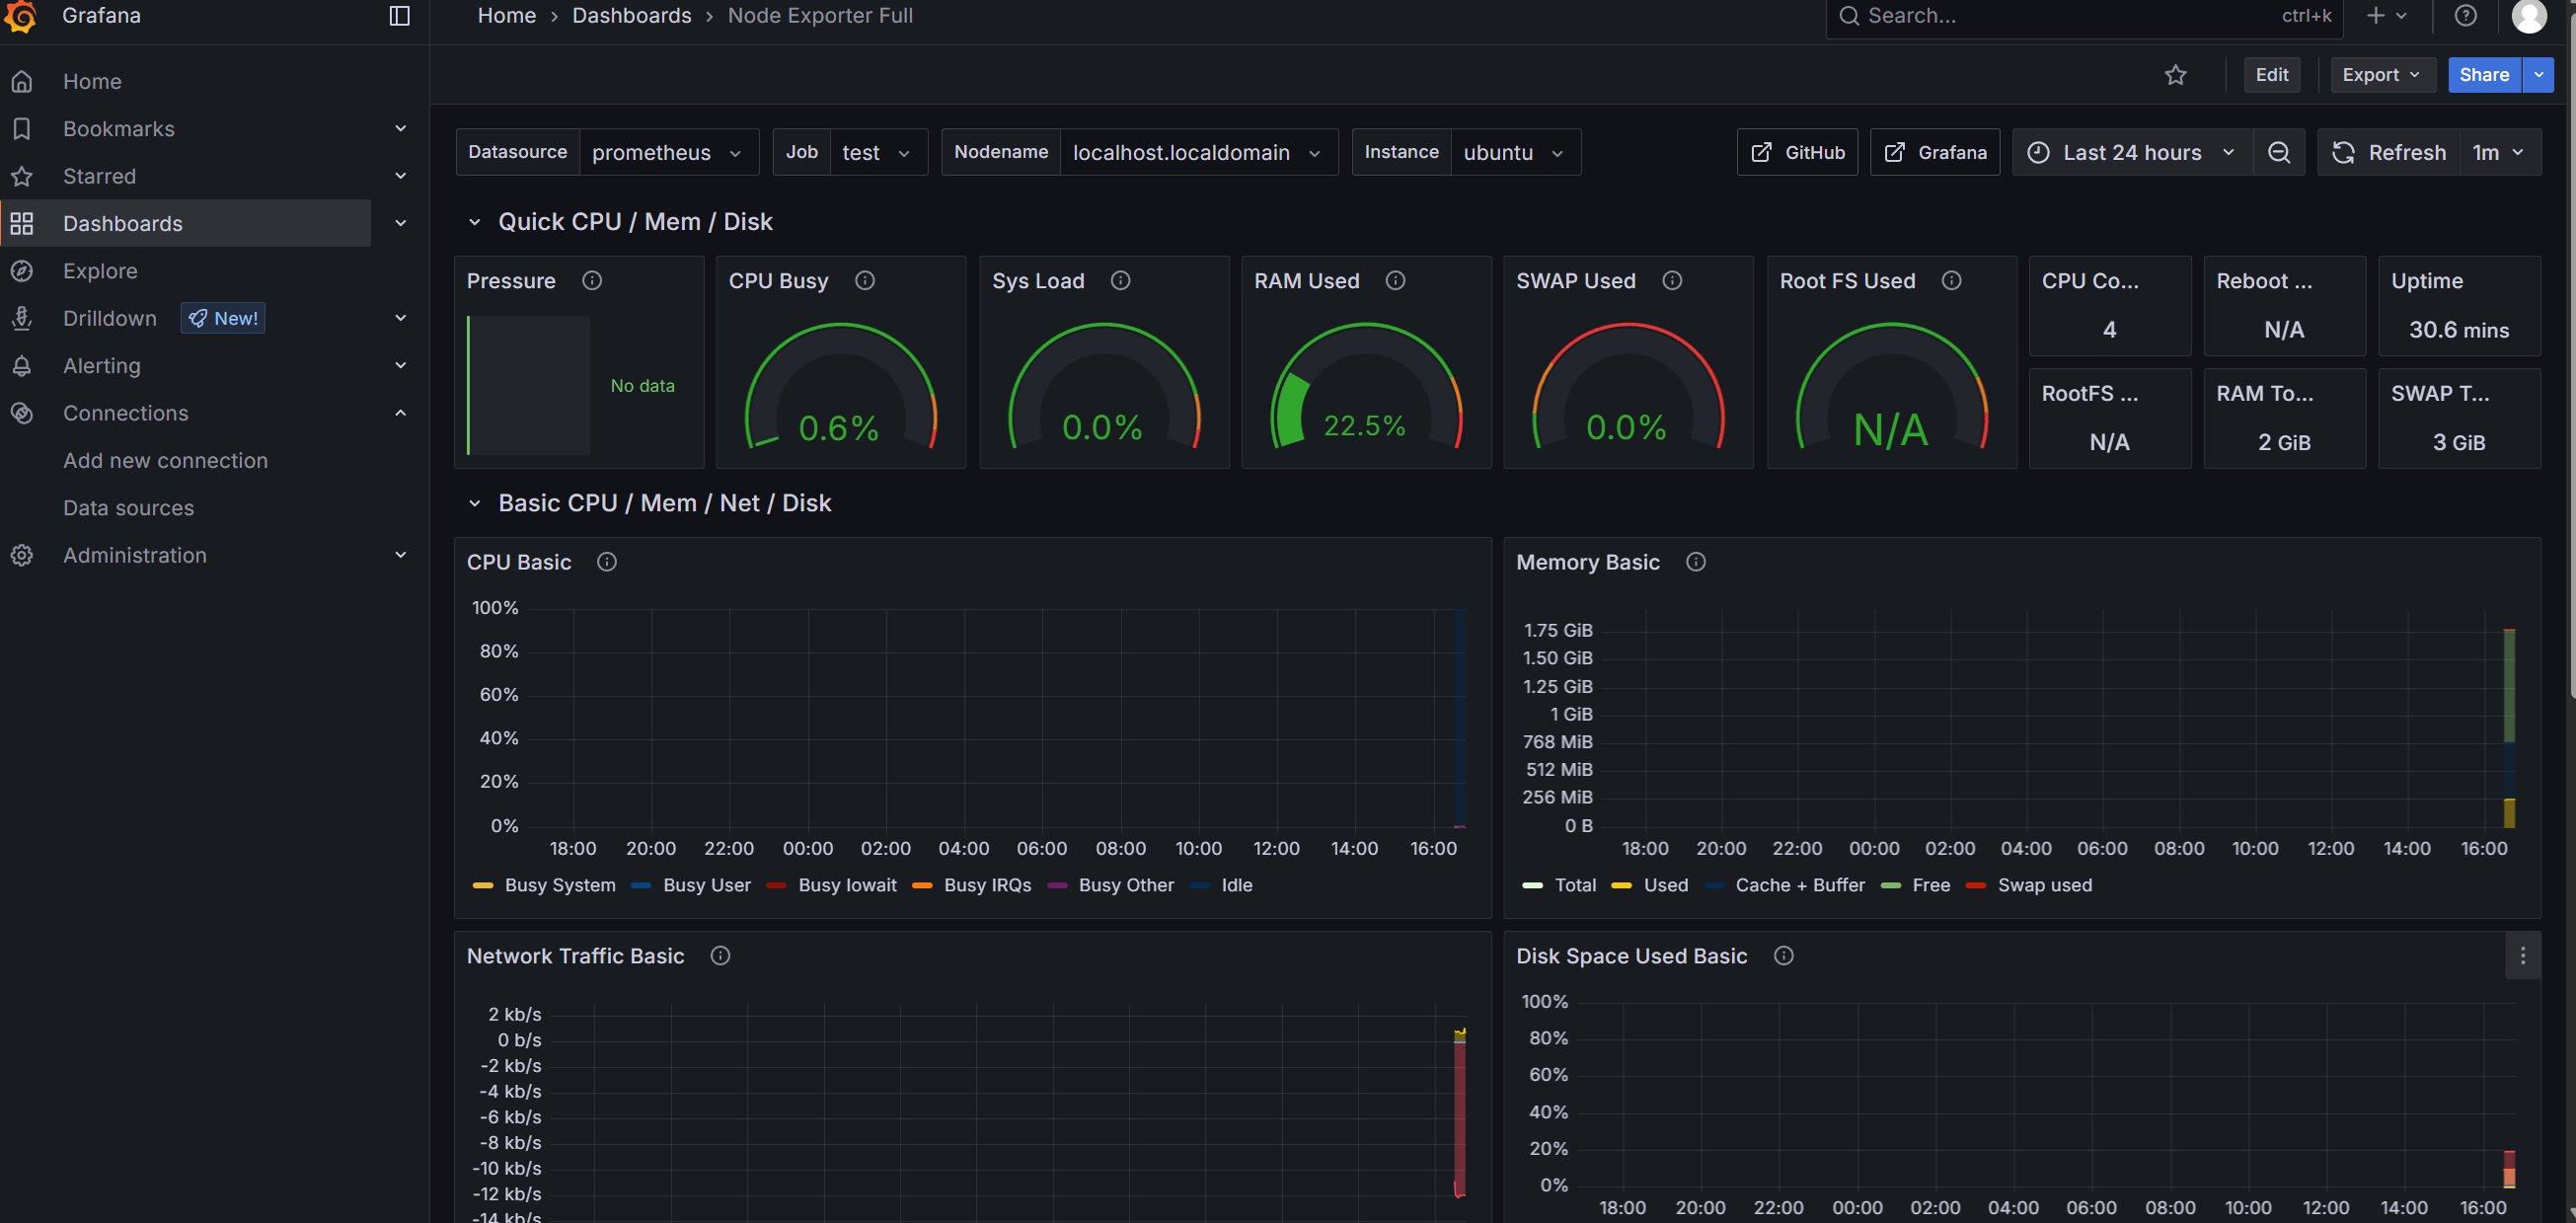
6. 添加监控模板
网页登录 Grafana。
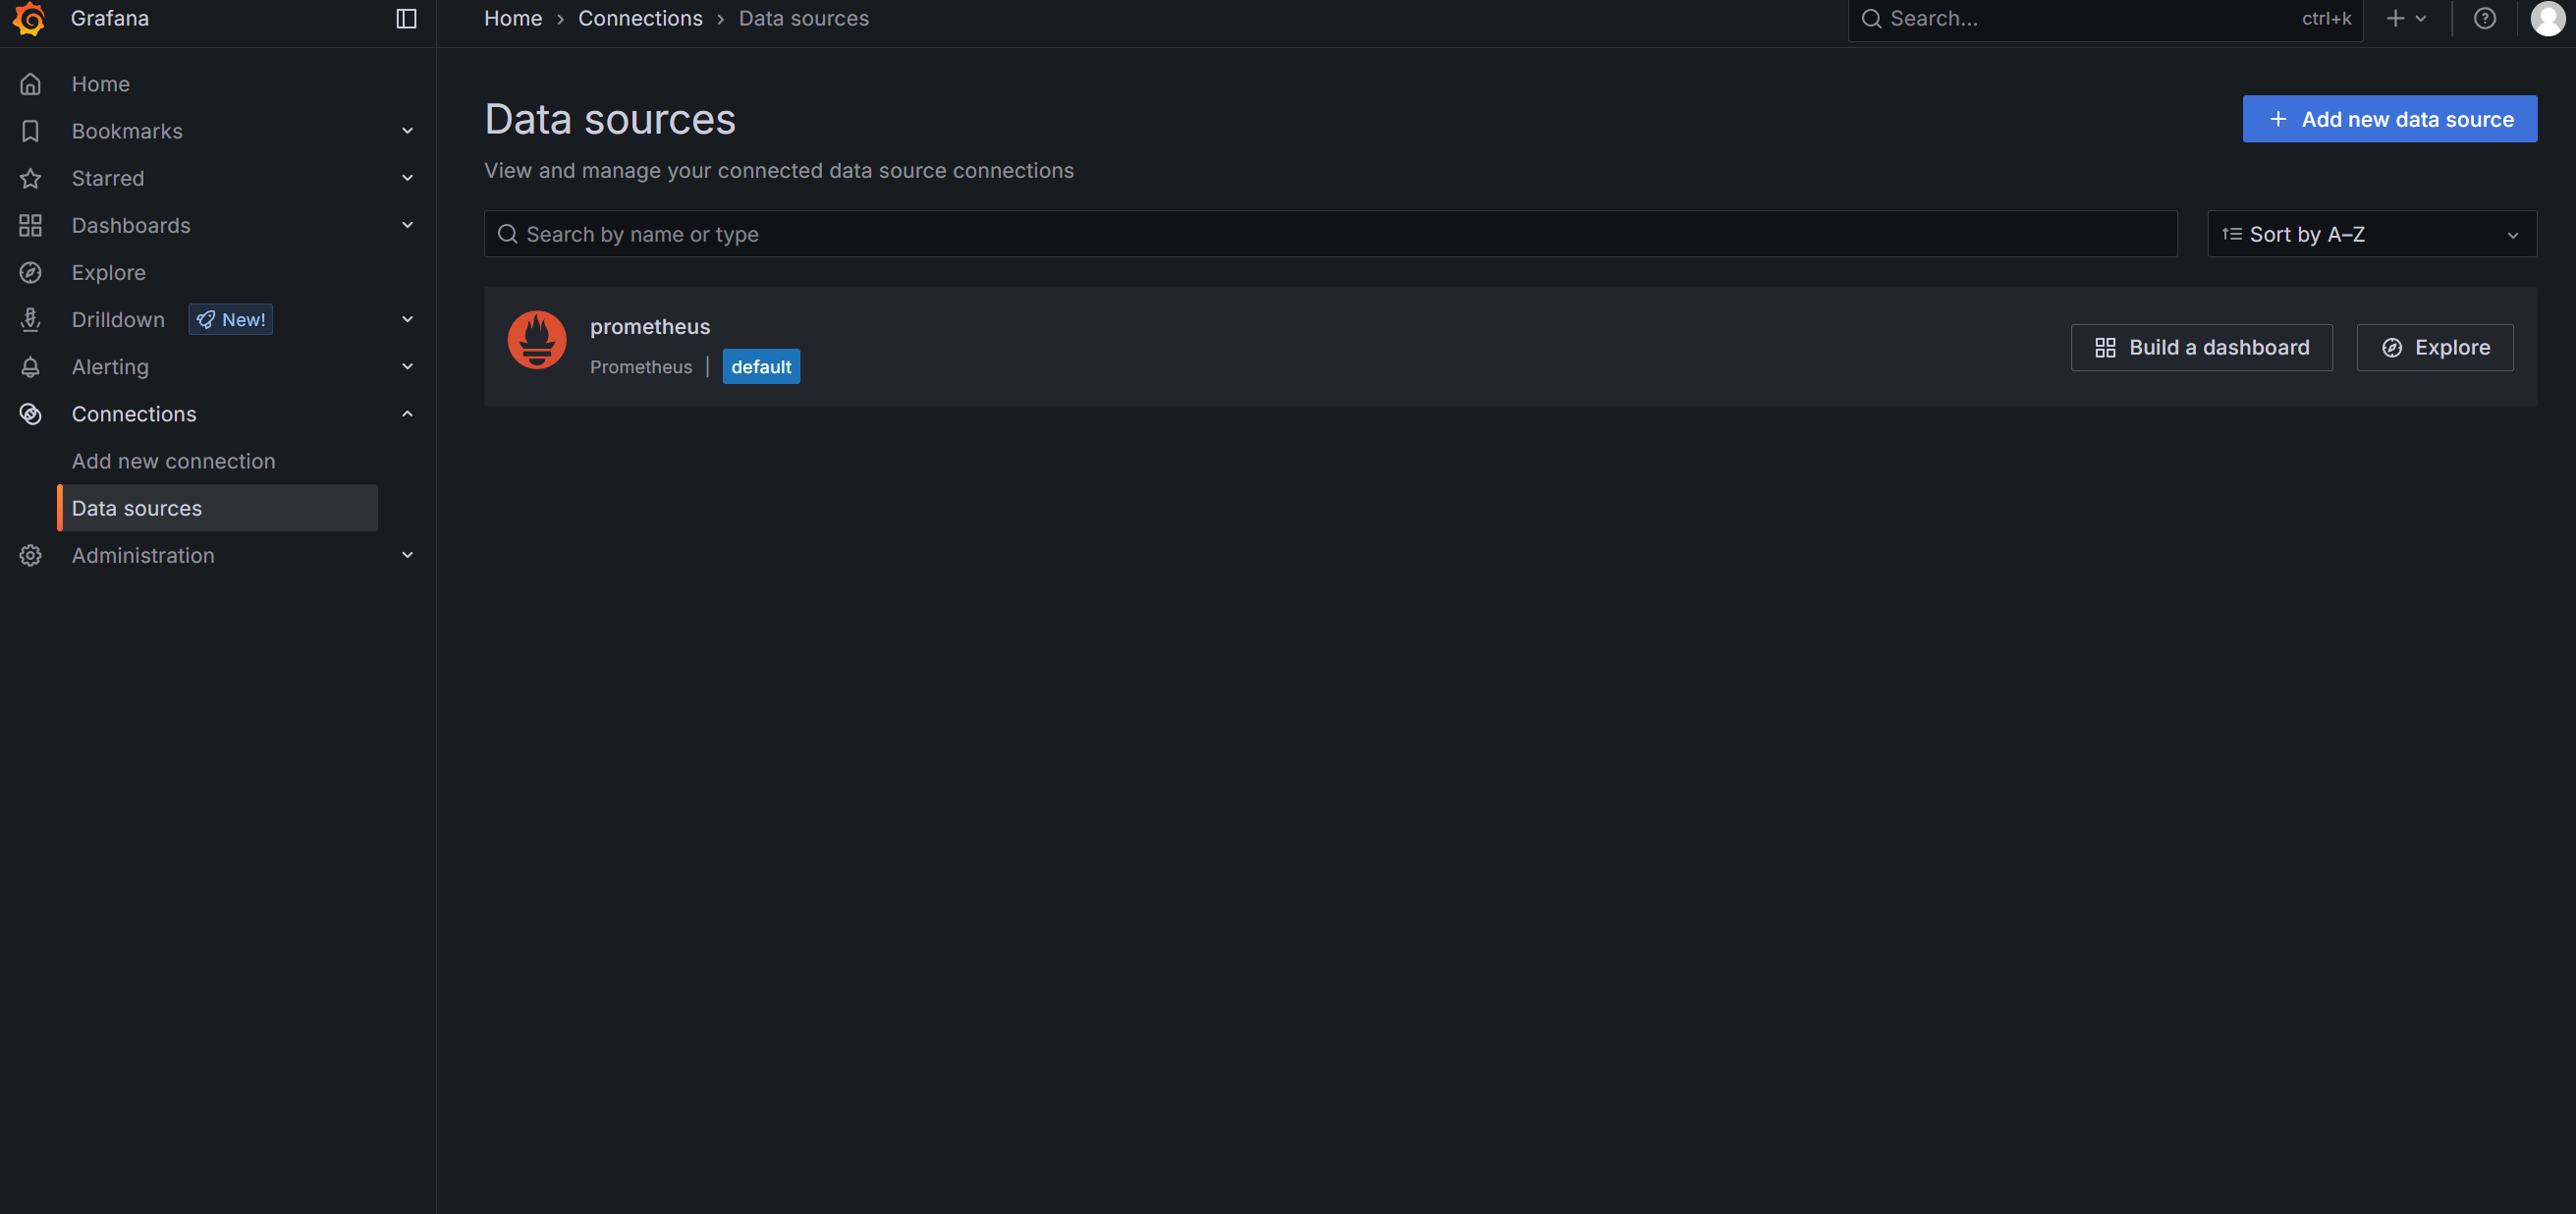
依次点击左侧 Connections > Data source > Add data source,选择 prometheus。
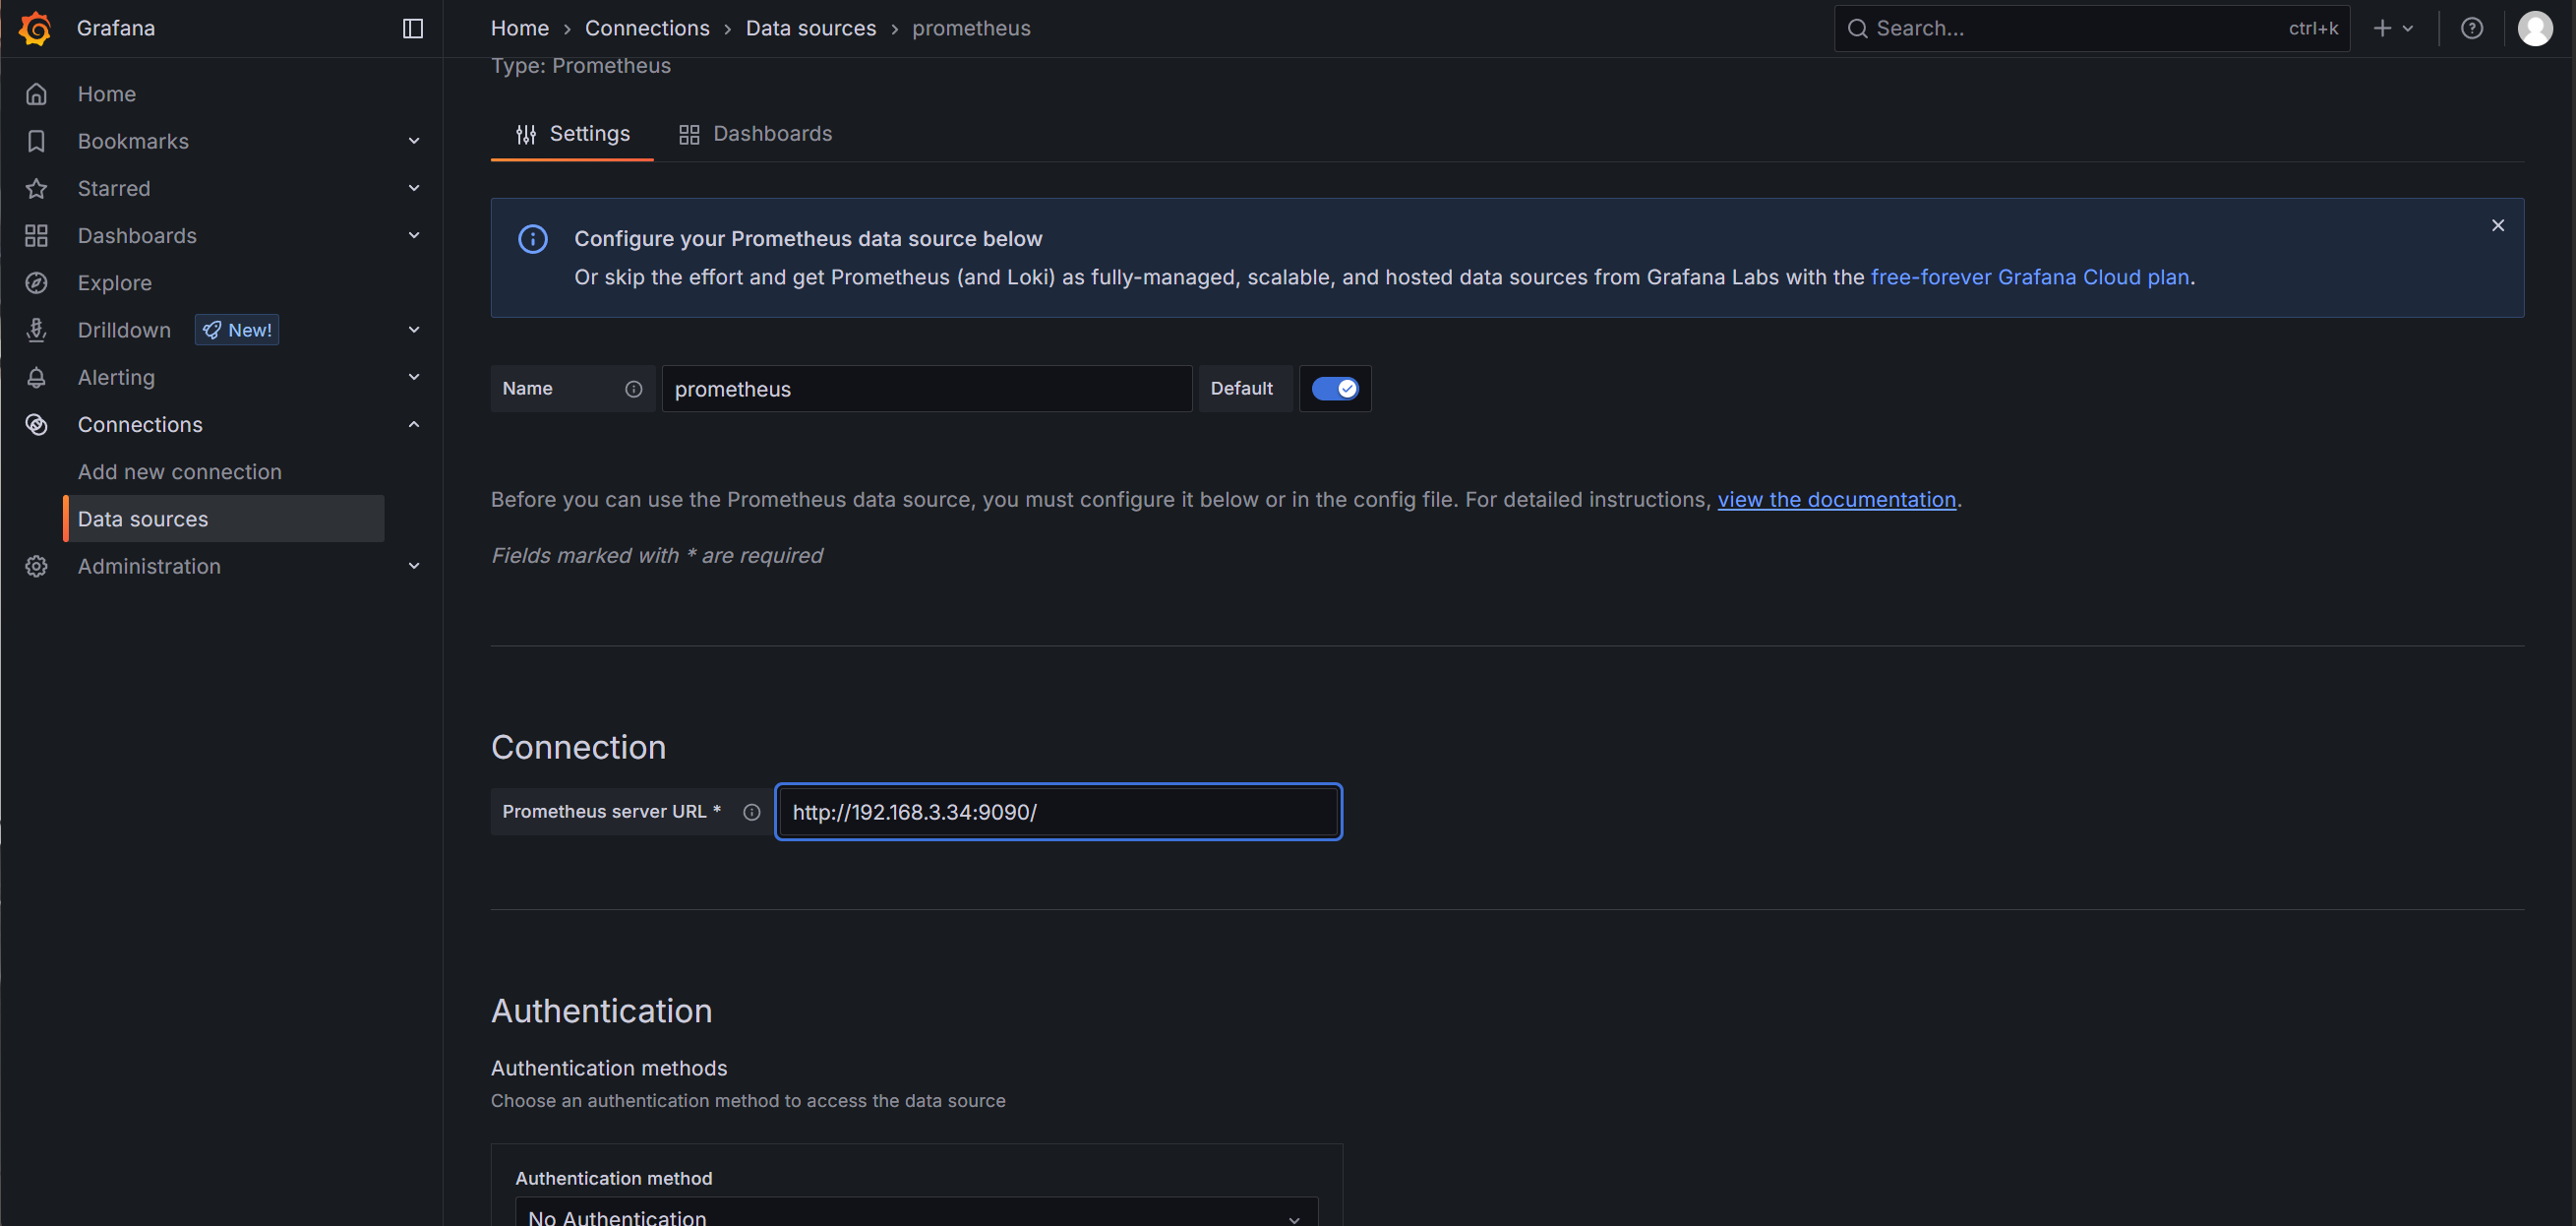
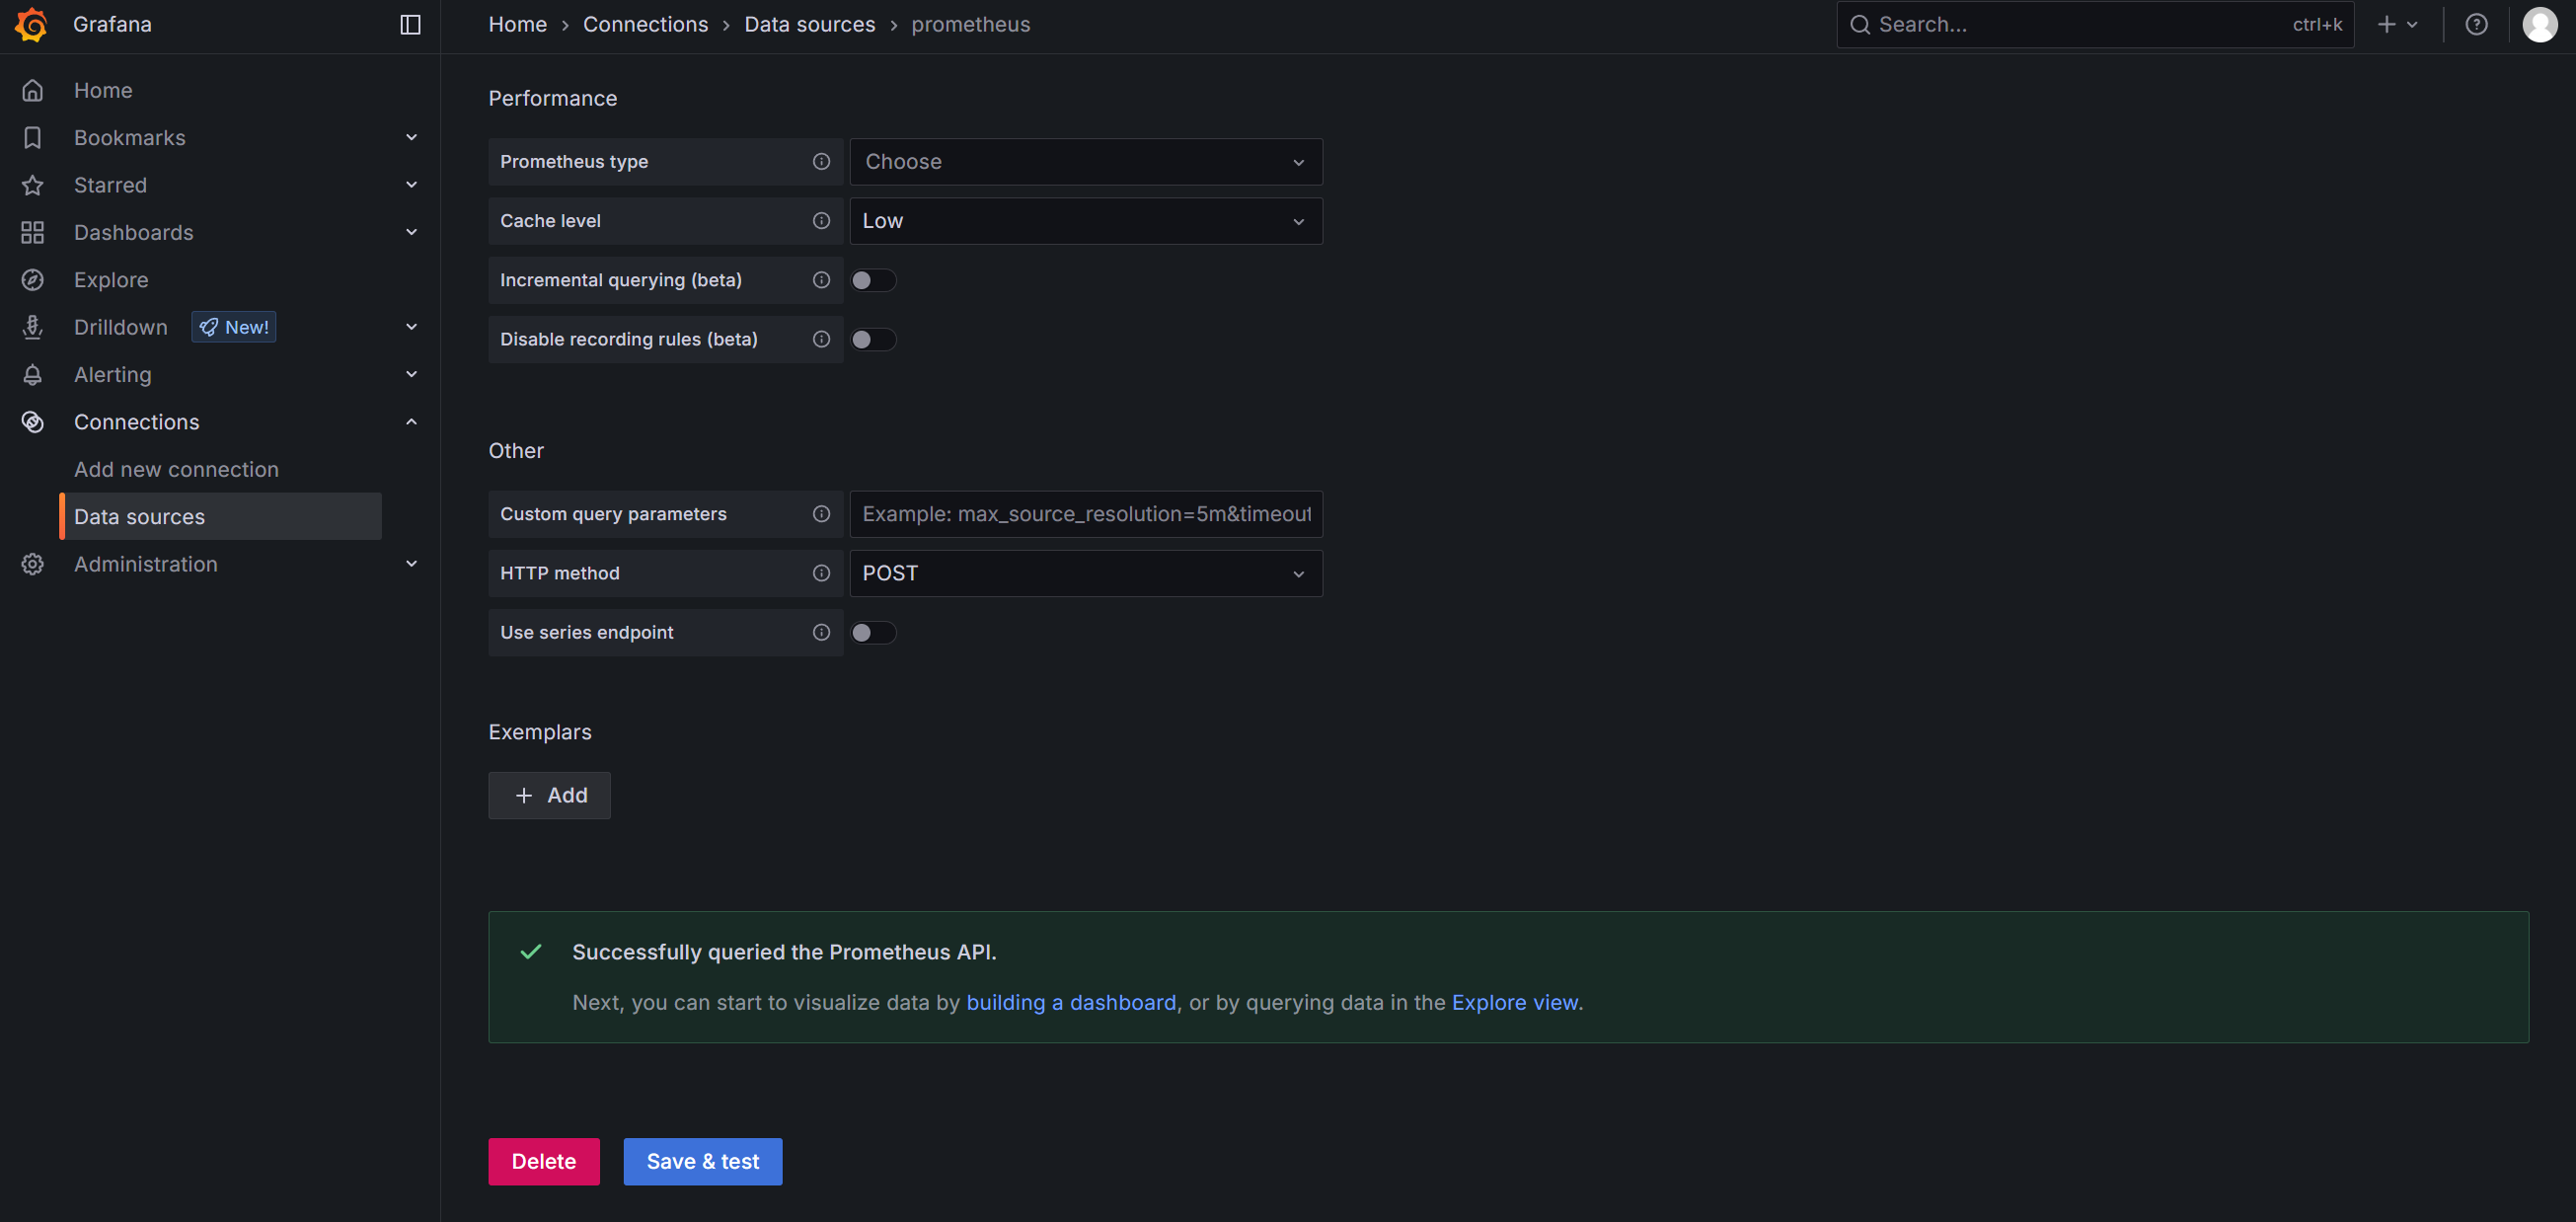
输入 name 和 IP 地址,点击 save。
+ 号,点击 Import dashboard。
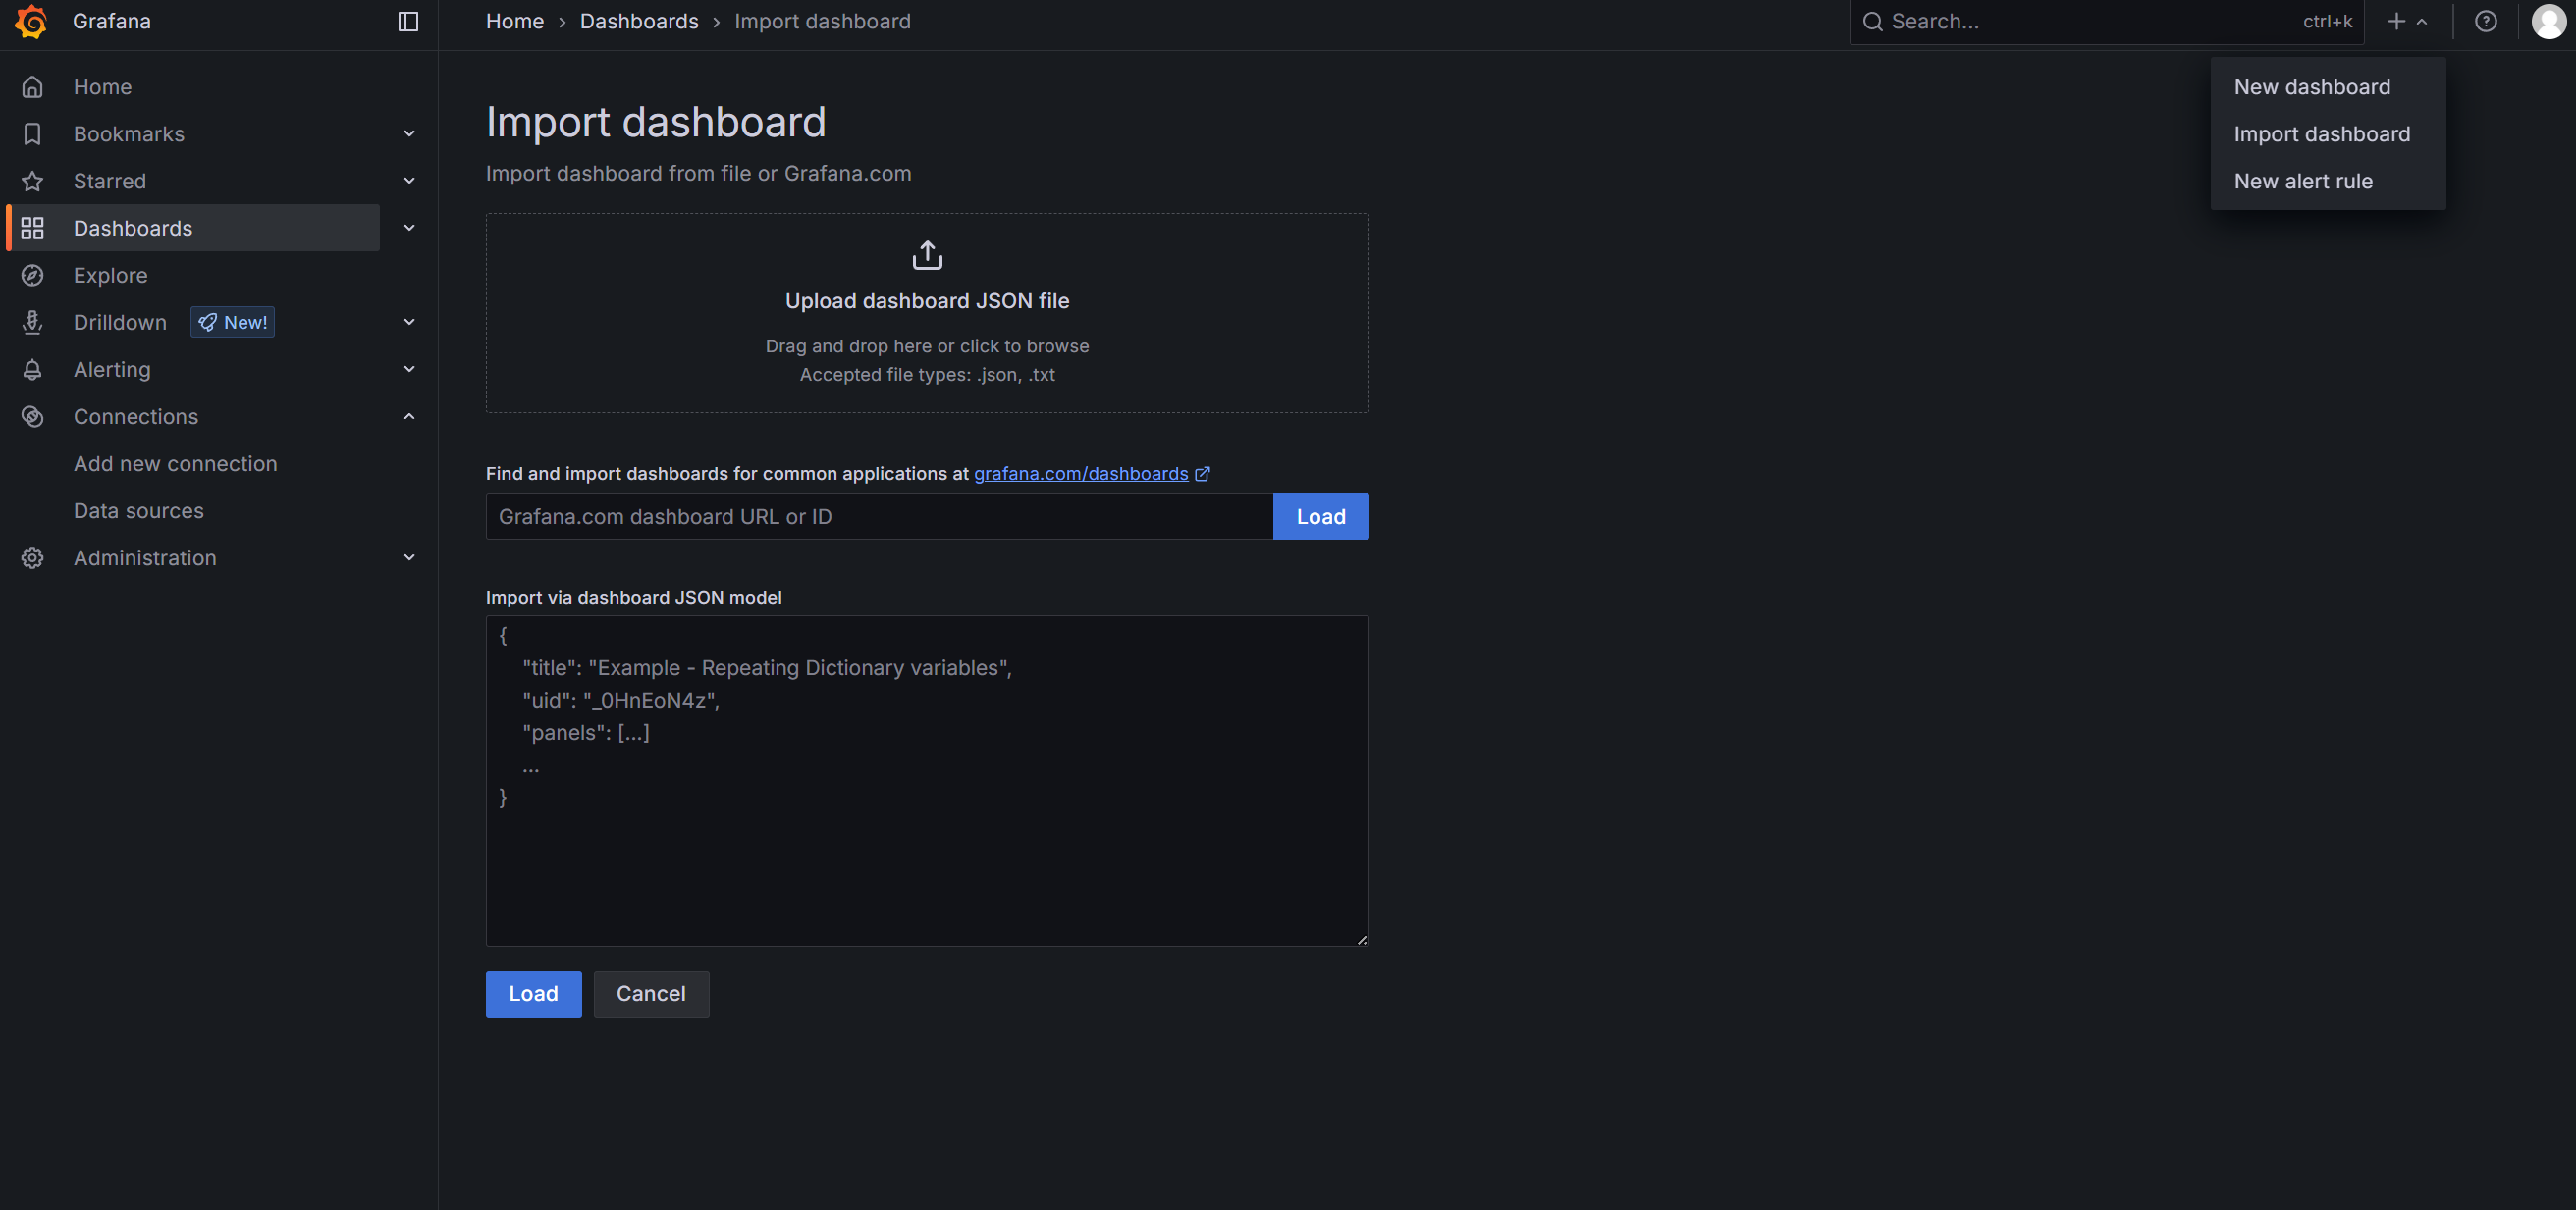
下载需要的 dashboard 页面。
- 浏览器访问
https://grafana.com/grafana/dashboards/,下载需要的模板。
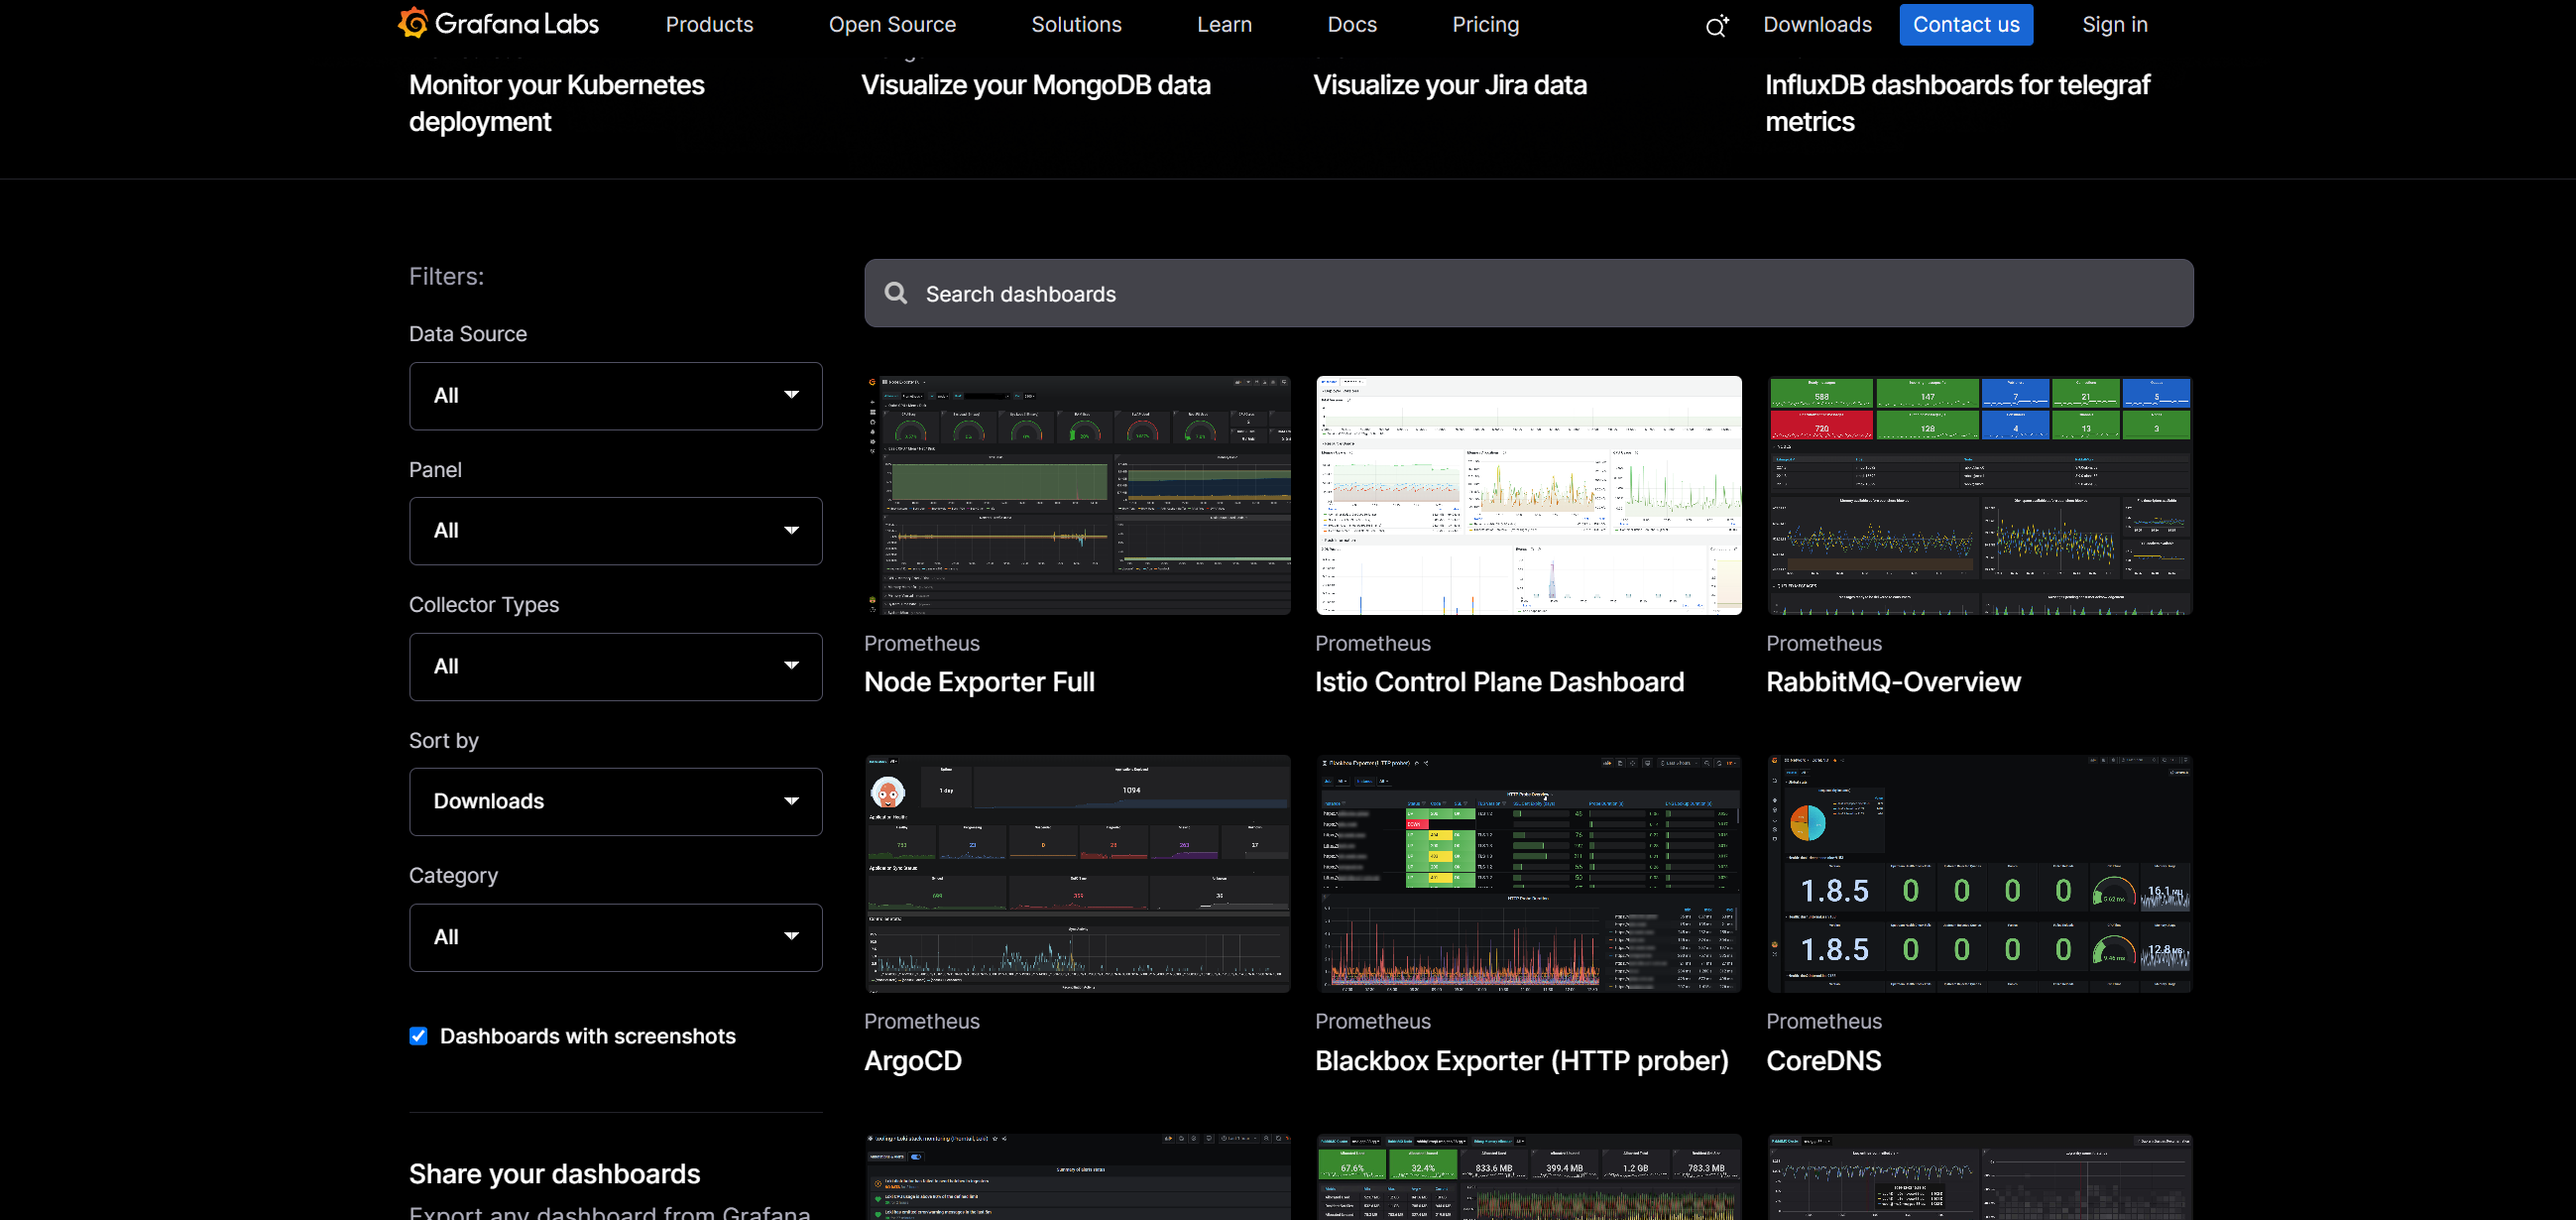
下载 json 文件,上传 json 文件。
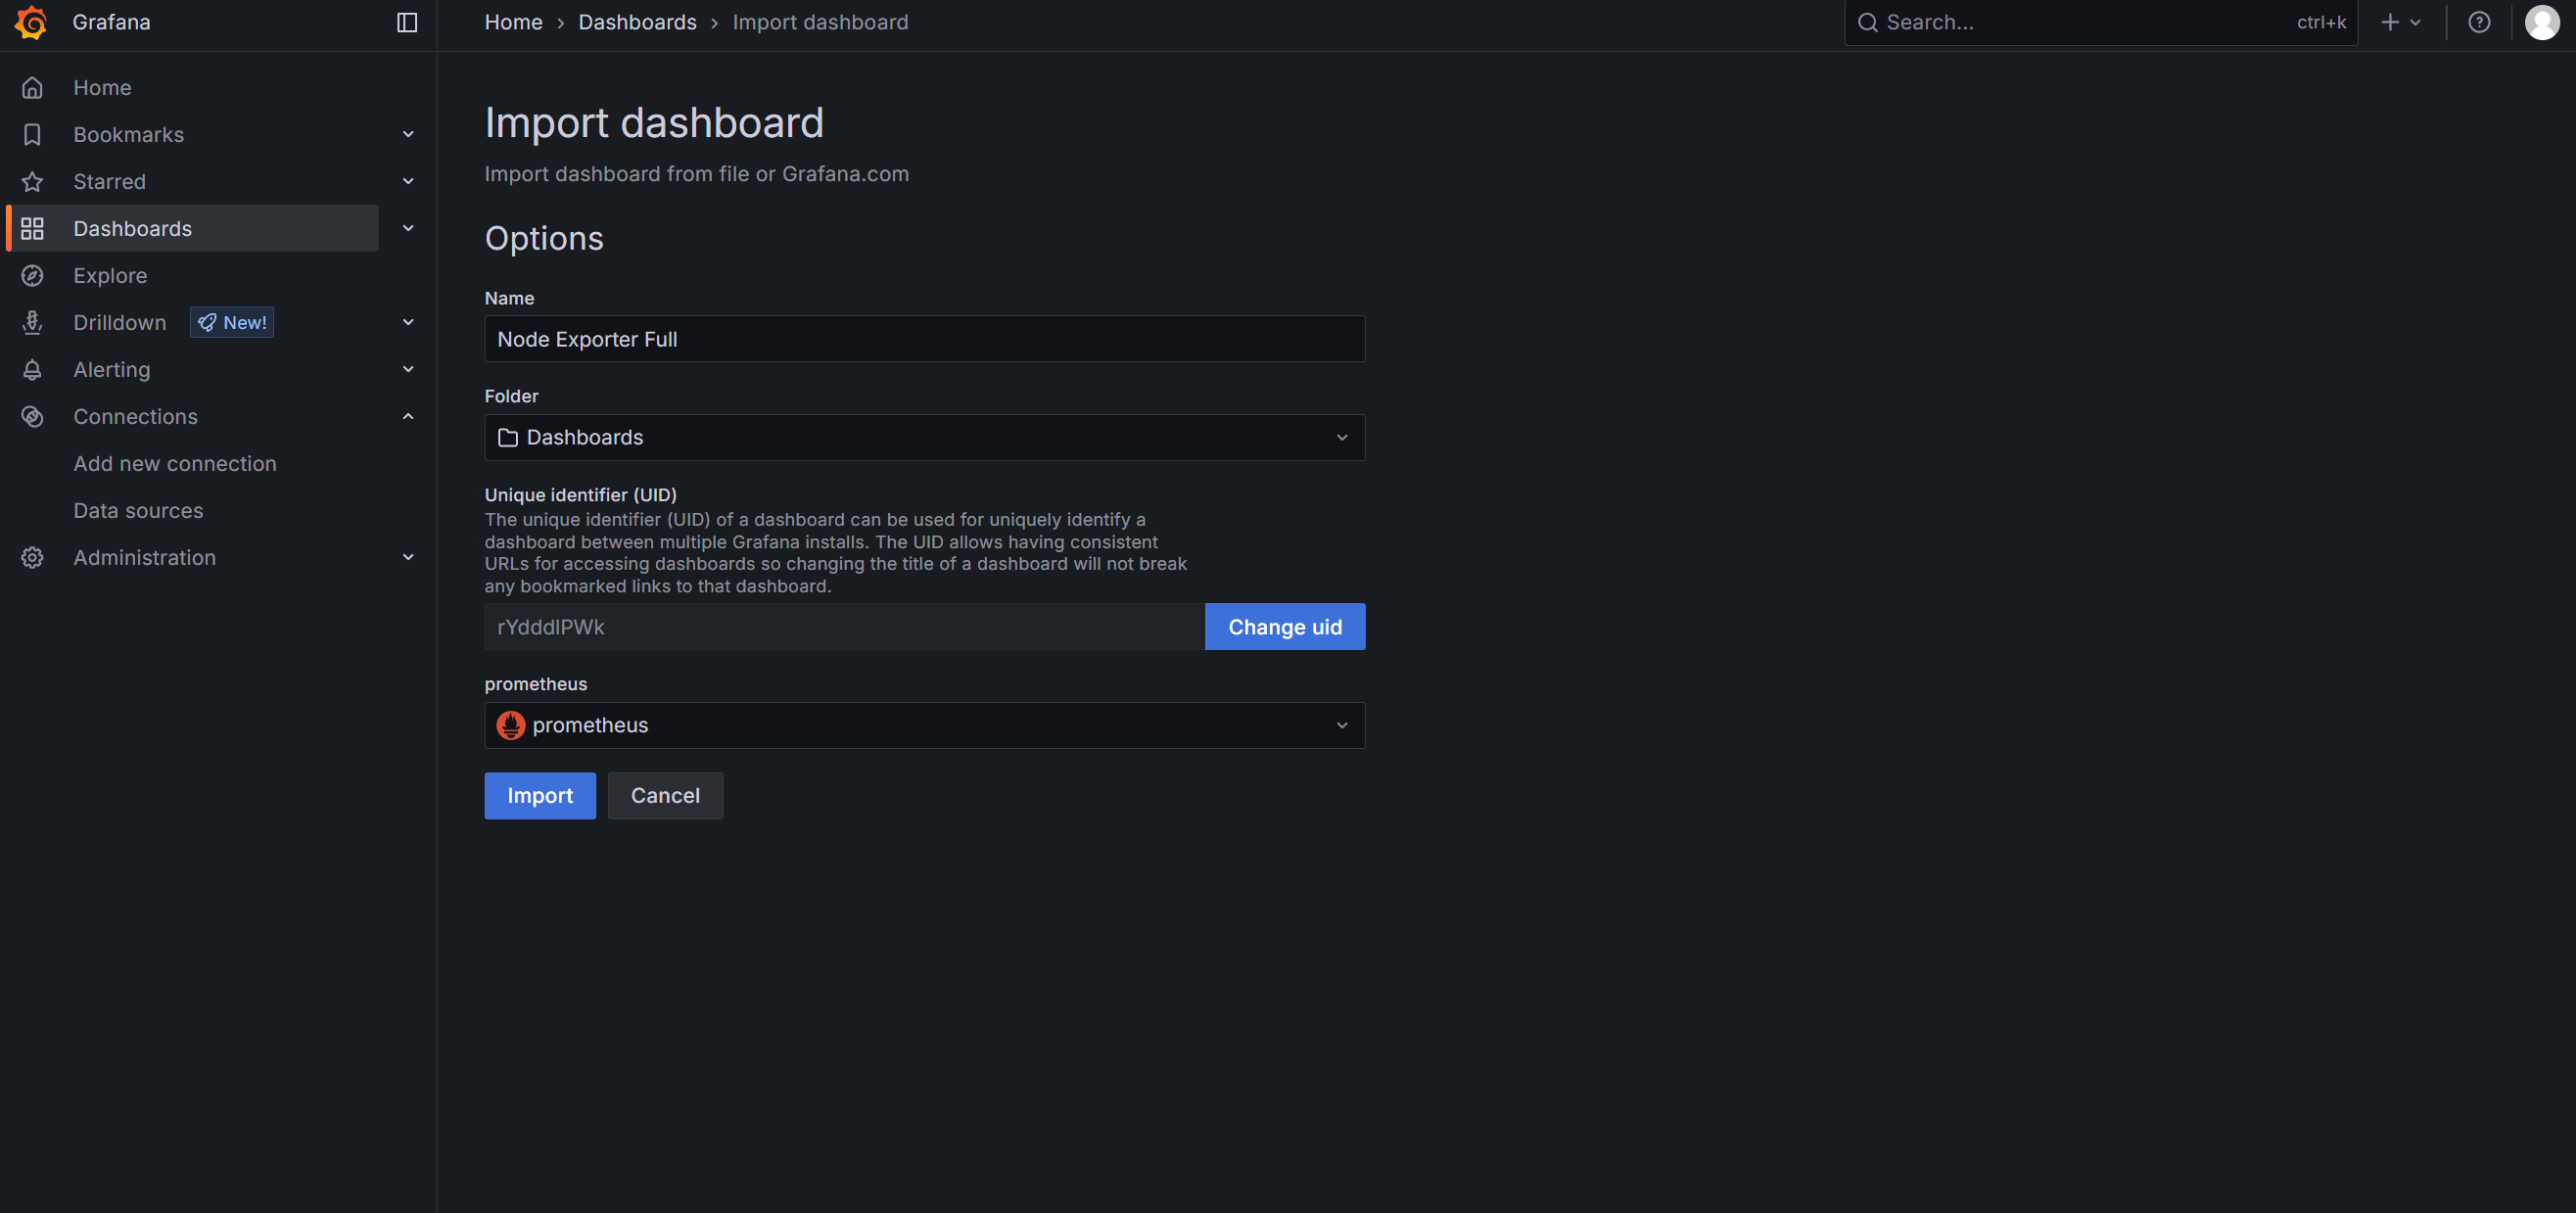
导入后展示: